Operational Dashboards & Analytics

Real-Time Insights with
ALMASONS GiNi® DASHBOARDS

GiNi Dashboards deliver real-time warehouse visibility through interactive dashboards.
Track workforce productivity, monitor KPIs, and gain insights to improve performance and decisions.

Labor Management Dashboard displaying bar and pie charts. Top metrics include employee tonnage, goal rates for products, and operator performance.
Performance Visibility & Insights

Visibility That Improves Performance

Turn your data into actionable insights that help teams improve productivity, visibility, and overall performance, with a guaranteed 10% efficiency improvement.

01

Improve Workforce Productivity

Track workforce activity and productivity trends through clear, easy-to-understand dashboards.

02

Gain Real-Time Visibility

Monitor KPIs and activity across teams, shifts, and processes as they happen.

03

Enable Faster Decisions

Identify performance gaps quickly and take action using clear visual insights.


Interactive Data Visualization

Insights at a Glance with GiNi Dashboards

Visualize performance and activity through intuitive GiNi dashboards designed to make complex data easy to understand.

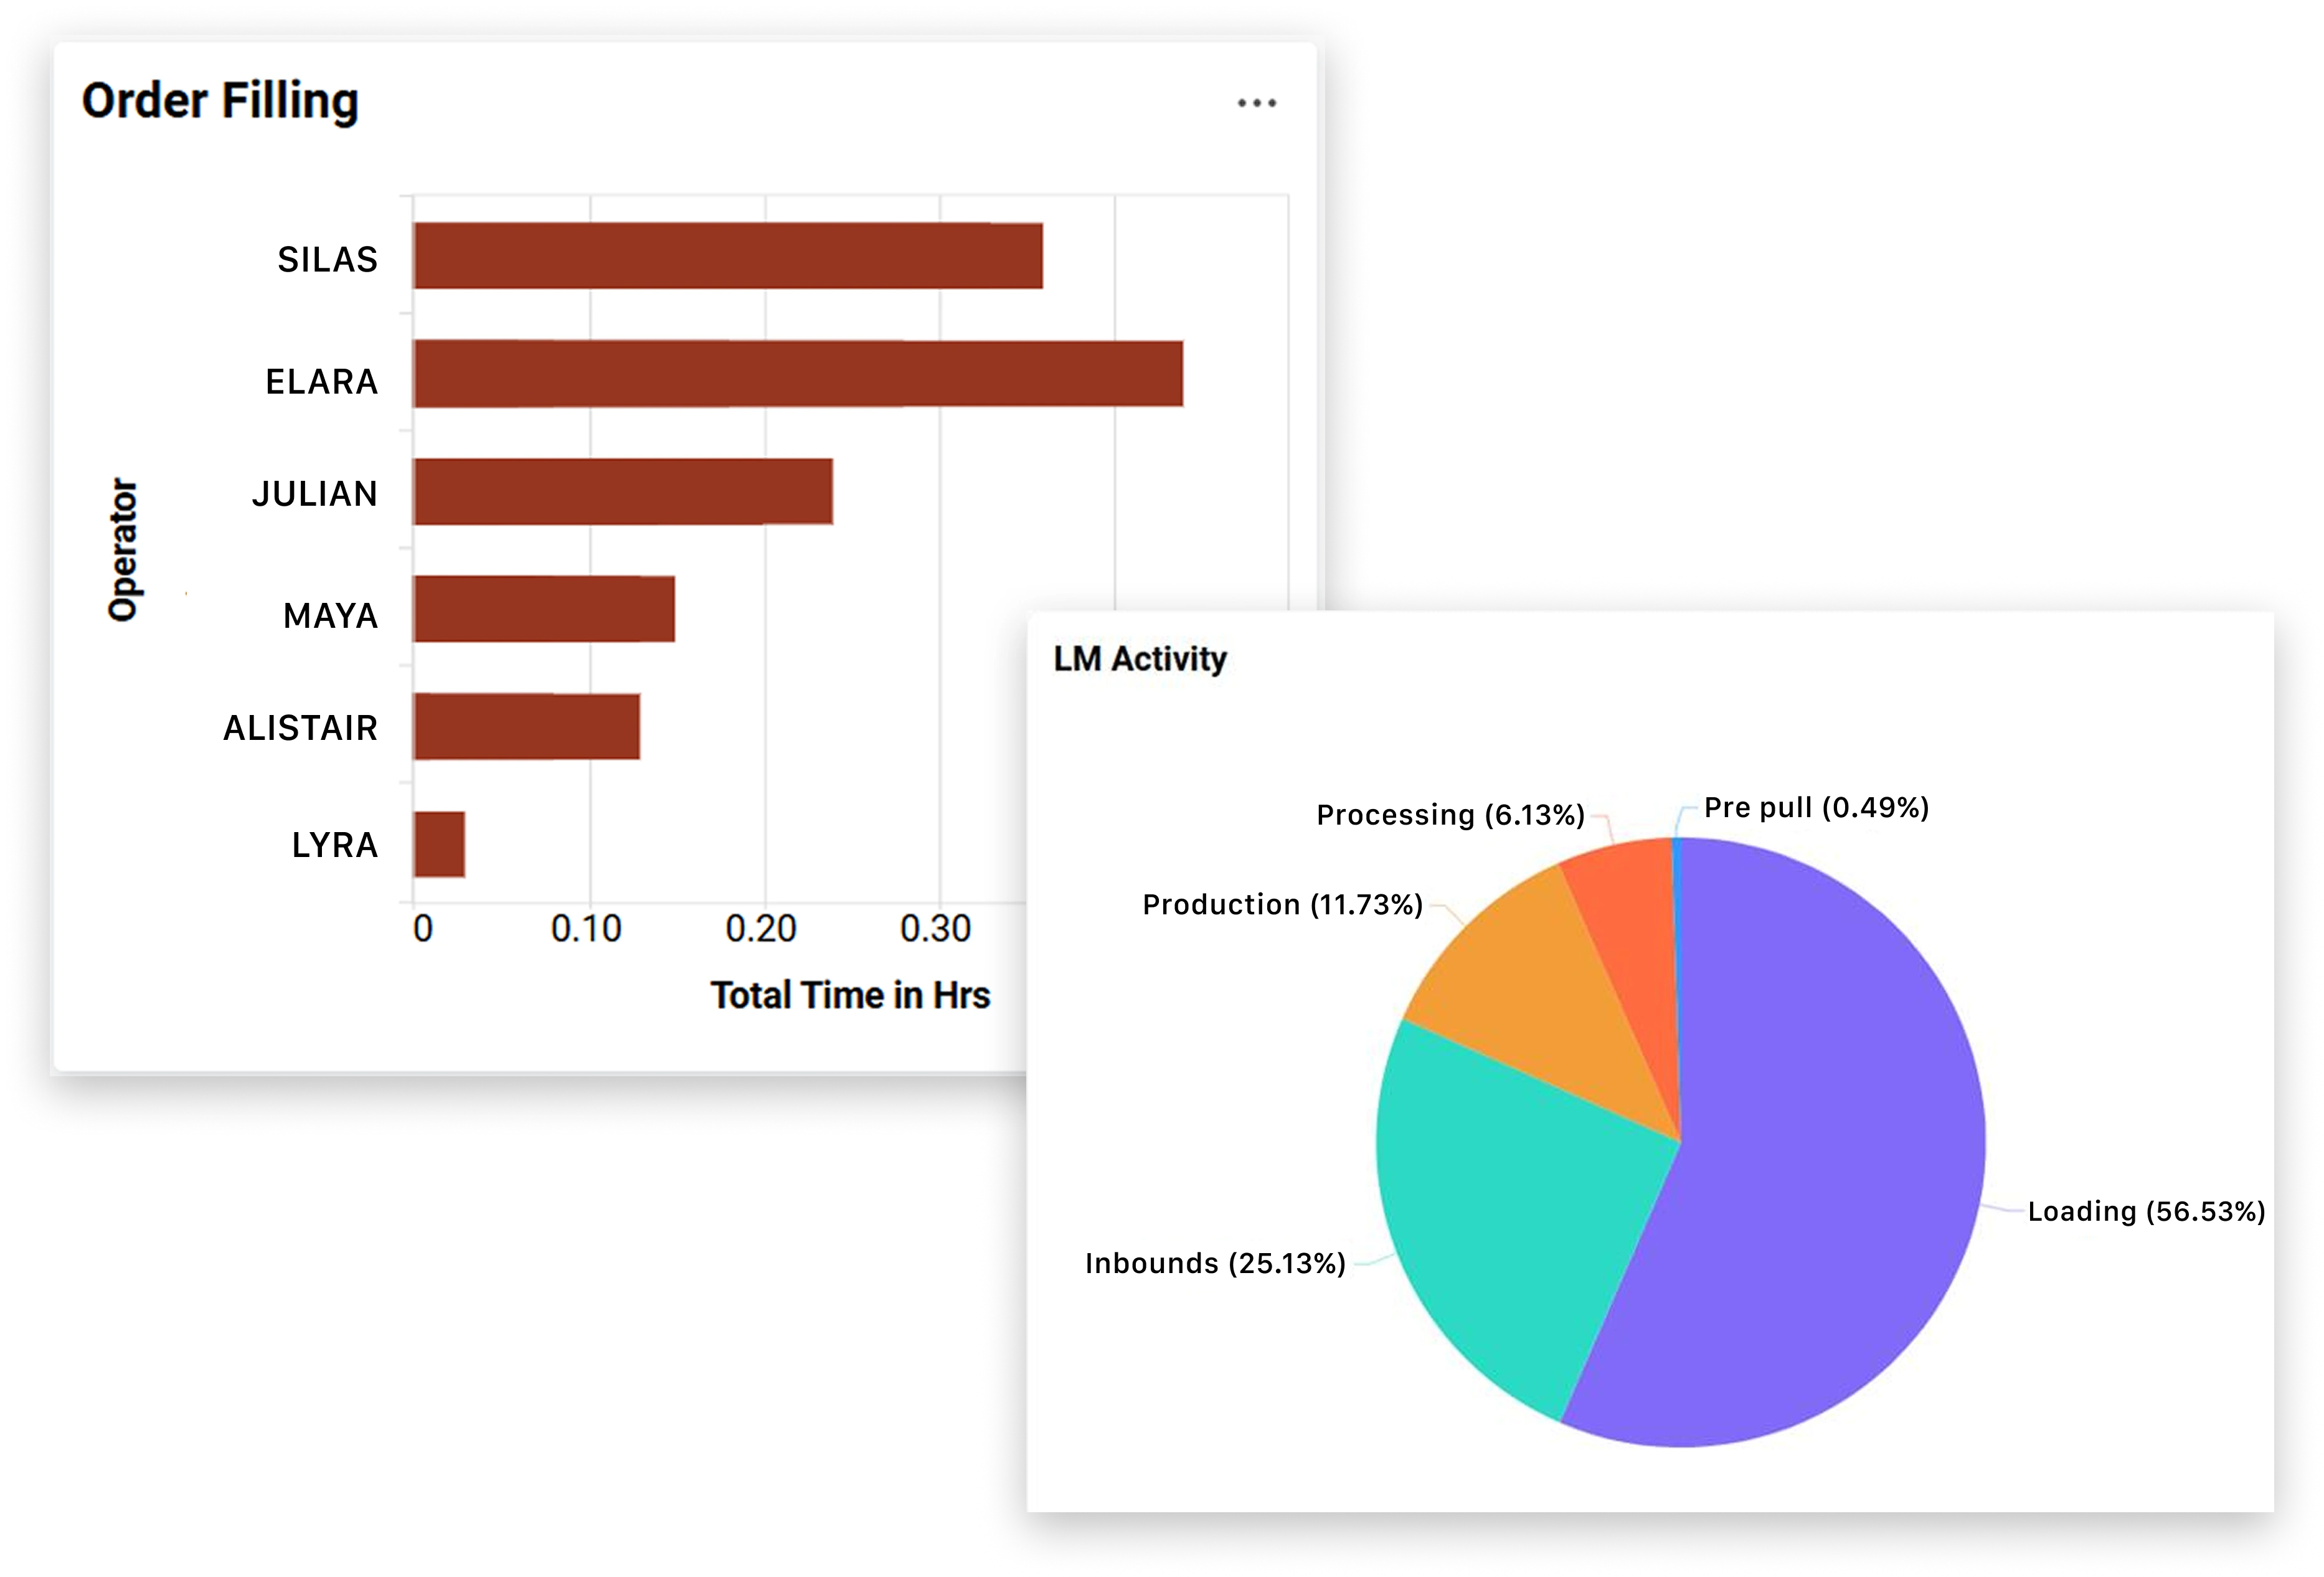
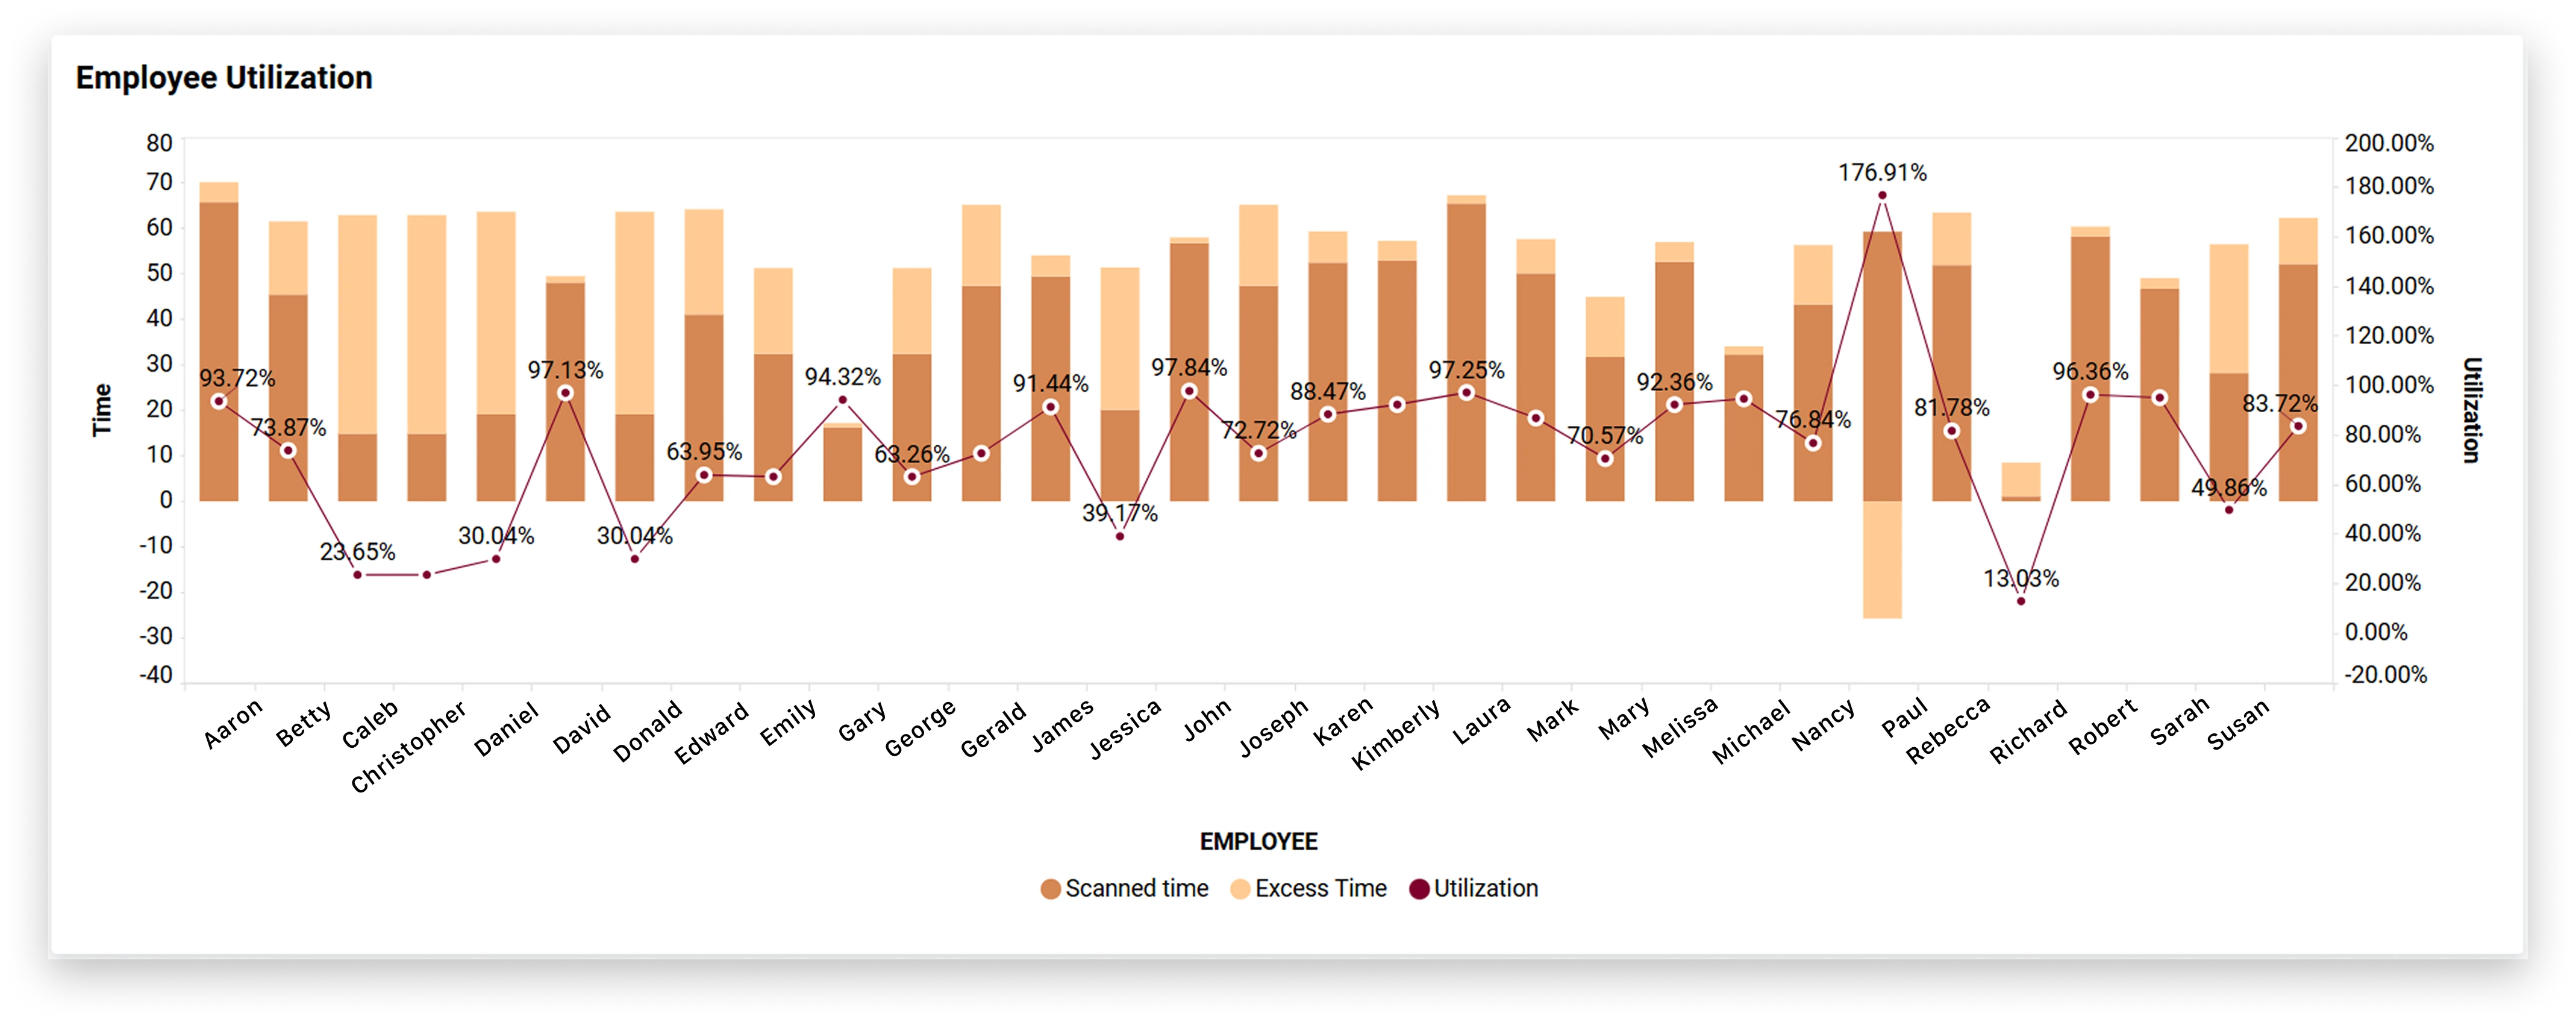
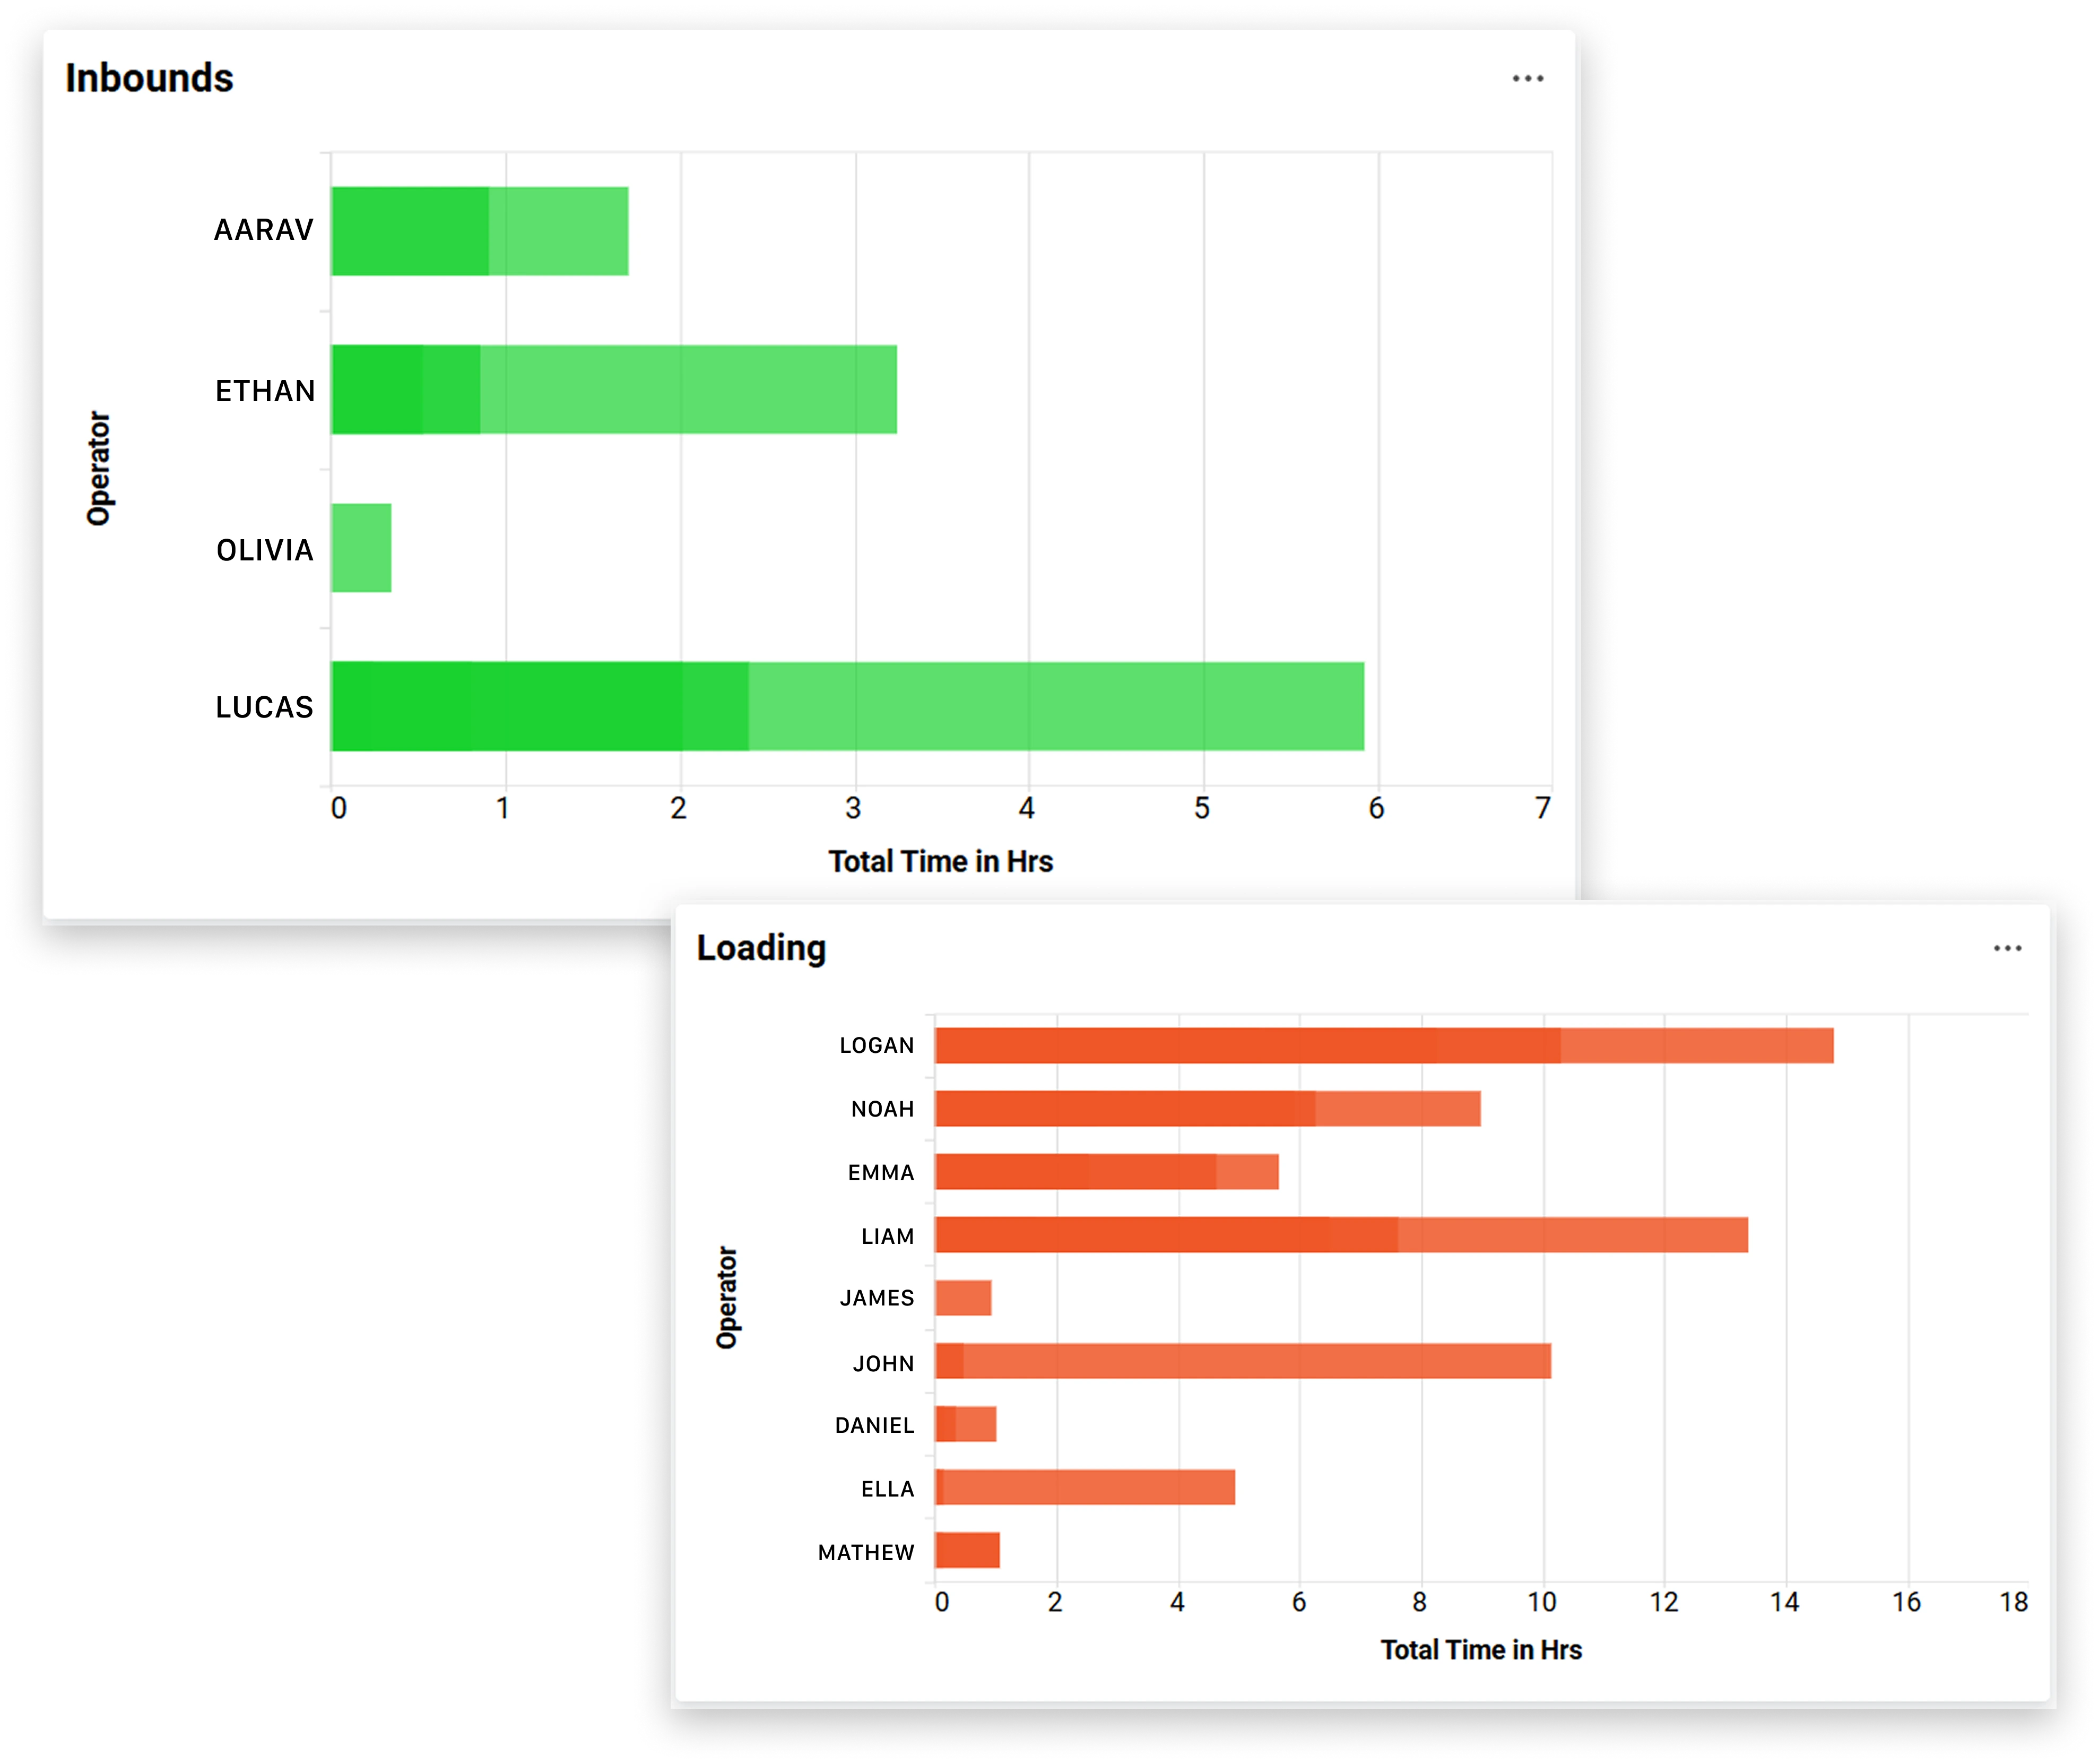
Visualize Operational Data Clearly

GiNi Dashboards transform operational data into intuitive visual dashboards using charts, graphs, and performance widgets. These dashboards help teams understand how activities progress across facilities, teams, and operational workflows.

GiNi also provides prebuilt dashboards for common operational scenarios, while additional dashboards can be customized to match specific reporting needs.

Bar chart showing Order Filling times in hours for operators. Pie chart of LM Activity shows Loading as the largest segment at 56.53%.

Analyze Trends and Patterns Easily

Identify patterns across activities over time to understand changes in performance, detect inefficiencies, and uncover improvement opportunities. Dashboards auto-refresh in real time, ensuring analysis is always based on the latest data without manual updates or delays.

Bar and line graph titled Employee Utilization shows scanned time, excess time, and utilization percentage for employees, with varied performance metrics.

View Role-Based Dashboards Securely

Different roles require different levels of visibility. GiNi Dashboards provide role-based and management-specific dashboard views, allowing each user to access insights relevant to their responsibilities.

Leaders can review high-level performance while supervisors and teams focus on activity-level insights.

Two bar charts showing the operator performance.
Cross-Functional Data Visibility

Performance Visibility in One View

GiNi Dashboards help teams understand activity across all supply chain workflows, bringing the required data into one view.

Labor Management

Understand workforce performance using attendance data from swipe-in and swipe-out tracking tools

  1. On-Time Attendance
  2. Late Arrivals
  3. Workforce Availability
  4. Workforce Trends

Receiving to Fulfillment

Track workflows across operations from receiving and putaway through order processing and shipment activity.

  1. Inbound Processing
  2. Storage Progress
  3. Outbound Movement
  4. Reverse Logistics

Connected Systems Data

Build dashboards using data from existing tools across supply chain and warehouse systems for unified visibility.

  1. Workforce Data Sources
  2. Operational Systems
  3. Supply Chain Platforms
  4. Unified Data View

Operational Insights

Dashboards combine operational data to help teams understand daily performance and workflow trends.

  1. Real-Time Monitoring
  2. Workflow Insights
  3. Trend Analysis
  4. Process Visibility
Two workers in safety vests analyze graphs on a large screen in a warehouse.
Live Floor Visibility

Live Dashboards on TV screens

Display GiNi dashboards on TV screens across your facility so teams can instantly see what’s happening, what’s on track, what needs attention, and where action is required.

With auto-refreshing data, everyone stays aligned and can respond faster without waiting for updates.

Simple, Transparent Pricing

No Hidden Costs

As long as you're on subscription, dashboard updates and enhancements are included. Your dashboards evolve with your operational needs — no surprise development charges.

Flexible Dashboard Updates

Transparent Pricing

No Additional Charges

Predictable Costs


Common Questions About Gini Dashboards

Frequently Asked Questions

A focused warehouse worker in a blue safety vest and headset is placing a box on a shelf.
Almasons GiNi® Dashboards provide interactive visual dashboards that present operational insights across supply chain and warehouse workflows. They help teams understand workforce activity, workflow progress, and operational performance through clear data visualizations.